
Best Indicators For Swing Trading
Are you tired of watching potential profits slip through your fingers in the stock market? Swing trading is probably the strategy you’ve been looking for. But to fully master this art, you need the right tools in your arsenal. 🎯
In this post, we will go into detail about the 3 best indicators for swing trading that every savvy trader should know. From the versatile Moving Average Convergence Divergence (MACD) to the practical Relative Strength Index (RSI) and the powerful Bollinger Bands, we will explore how these tools can revolutionize your trading strategy. Get ready to unlock the potential of best indicators for swing trading and take your swing trading to new heights! 📈💪
What is Swing Trading?
Swing trading is a strategy where you hold positions for several days to weeks, with the goal of profiting from price fluctuations. You’ll focus on:
- Identifying trends
- Entering at potential reversals
- Using technical analysis
- Managing risk with stop-losses
This approach offers a balance between day trading and long-term investing, suitable for those seeking a moderate time commitment and potential returns.
There are two types of price movements in swing trading:
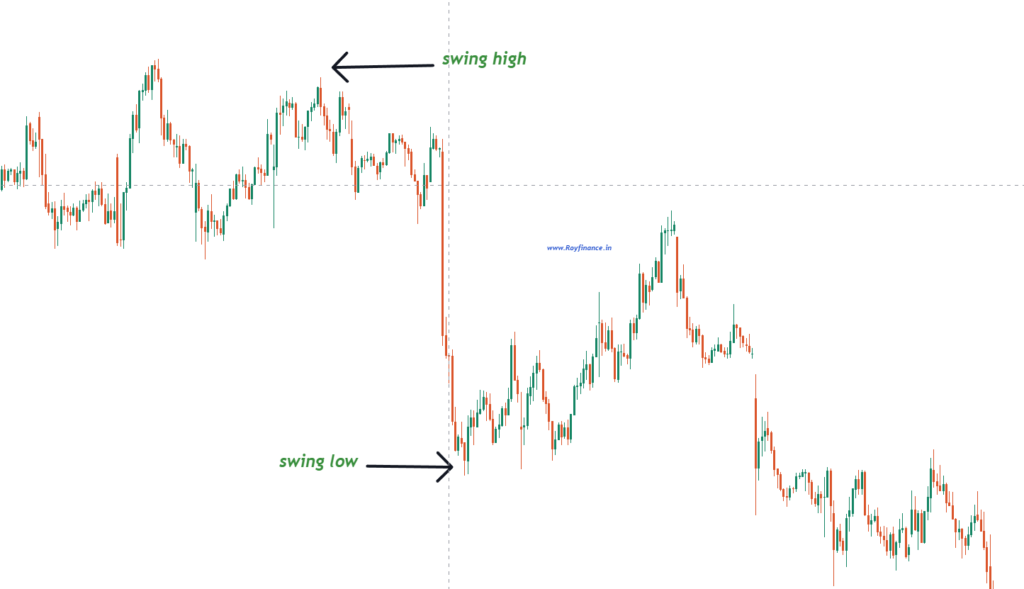
Swing high-
These occur when the market reaches a peak before changing its direction. This presents an opportunity for a short trade, where the goal is to sell at a higher price and buy back at a lower price.
Swing low-
This happens when the market drops and then bounces back. This provides an opportunity for a long trade, where the goal is to buy at a low price and sell at a higher price.
Why are indicators important for swing trading?
Indicators are essential tools in your swing trading arsenal. They provide you with valuable insights into market trends, helping you make informed decisions. Here’s why indicators are crucial:
- Trend identification
The indicators identify the market trend at an early stage and due to this, traders can take advantage of the up or down moves.
- Entry and exit signals
Swing trading indicators are meant to inform the trader about market trends and price activity, and therefore the best time to enter or exit positions.
- Risk management
Swing traders use indicators to determine optimal stop-loss levels and manage risk effectively.
- Confirmation of price movements
Indicators help confirm price action signals. For example, if a candlestick pattern signals a reversal, an indicator like the MACD or RSI can confirm the validity of the signal, increasing the chances of success.
Example: If a trader sees a bullish candlestick pattern and the MACD histogram turns positive, this can confirm the possibility of upward price movement.
By utilizing the best indicators for swing trading, you can enhance your trading strategy and potentially increase your profits. These tools help you analyze market momentum, identify overbought or oversold conditions, and spot potential reversal points, giving you a competitive edge in the dynamic world of swing trading.
3 Best Indicators for Swing Trading
Swing trading relies heavily on indicators to identify potential trading opportunities. Here are three of the best indicators for swing trading that can help you make informed decisions and improve your trading success.
Moving Average Convergence Divergence (MACD)
Now that we’ve explored why indicators are crucial for swing trading, let’s dive into one of the best indicators for swing trading: the Moving Average Convergence Divergence (MACD).
Understanding MACD basics
The MACD is a versatile indicator that helps you assess momentum by comparing two moving averages of a security’s price. It consists of three major components: the MACD line, the signal line, and the MACD histogram. You can use these elements to identify bullish or bearish momentum in your swing trading strategy.
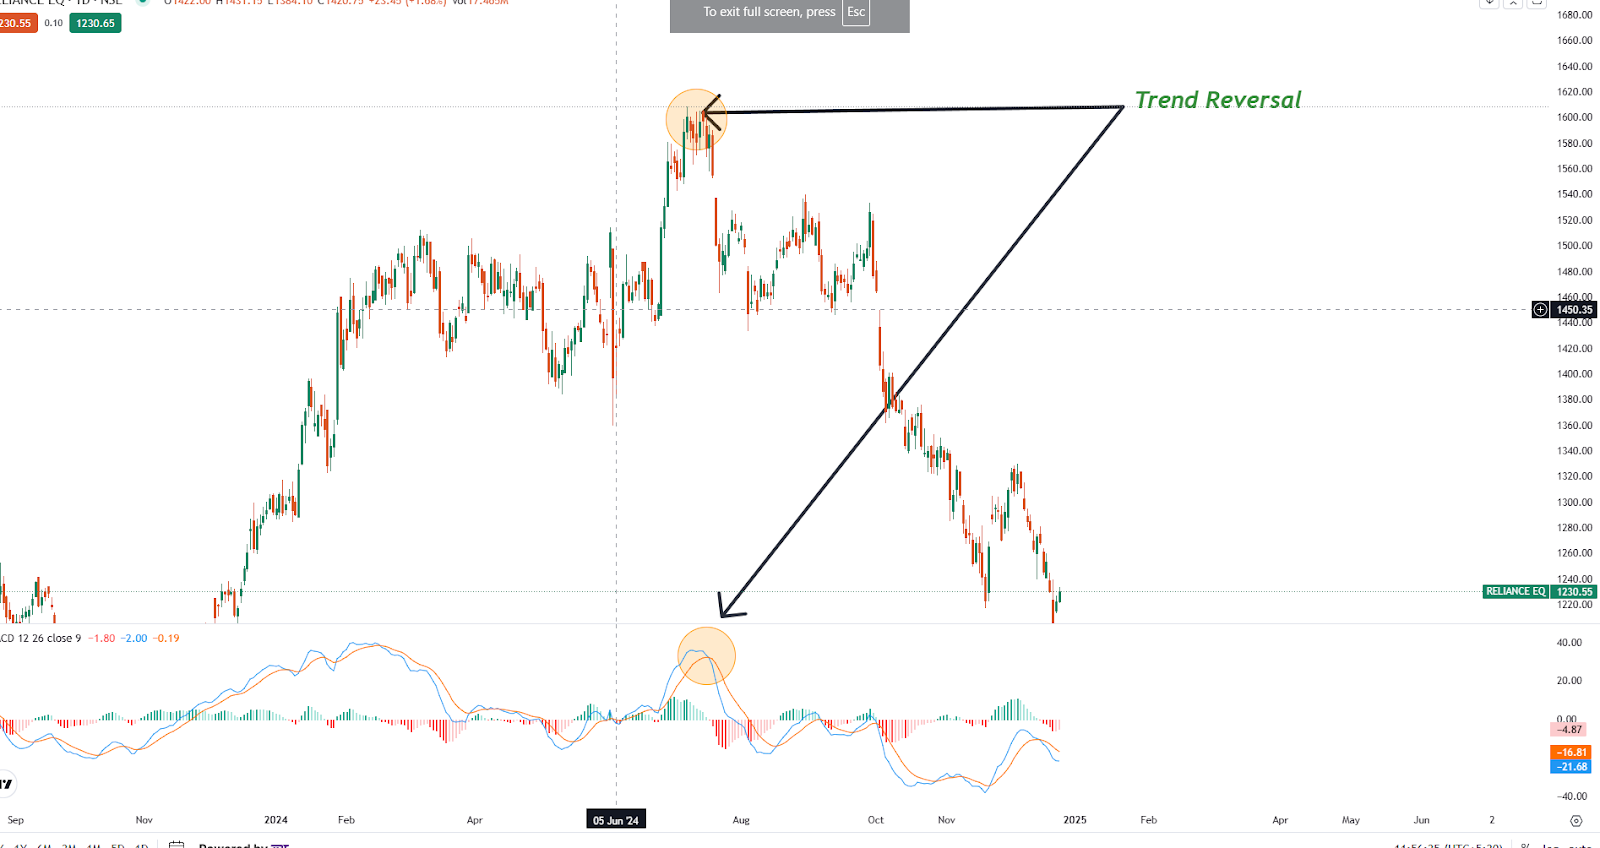
Identifying trend reversals with MACD
You can identify potential trend reversals by keeping an eye on MACD crossovers. When the MACD line crosses above the signal line, it is often considered a signal to buy. Conversely, when it crosses below, it may indicate a selling opportunity. Keep in mind that while MACD is powerful, it is a lagging indicator, so you should use it in conjunction with other tools for more accurate predictions.
How to Use
The MACD line is the difference between the 12-day and 26-day EMAs. The signal line is the 9-day EMA of the MACD line. The histogram shows the difference between the MACD line and the signal line. When the MACD line passes above the signal line, it indicates a buy signal. When it passes below, it indicates a sell signal.
2.Relative Strength Index (RSI)
Now that we’ve explored MACD indicators that are crucial for swing trading, let’s dive into one of the best indicators for swing trading: the RSI.
How RSI works for swing trading
You can use the Relative Strength Index (RSI) to identify potential buying and selling opportunities in swing trading. This momentum oscillator operates on a scale from 0 to 100, helping you spot overbought (above 70) and oversold (below 30) conditions. By analyzing these levels, you can predict possible price reversals and make informed trading decisions.
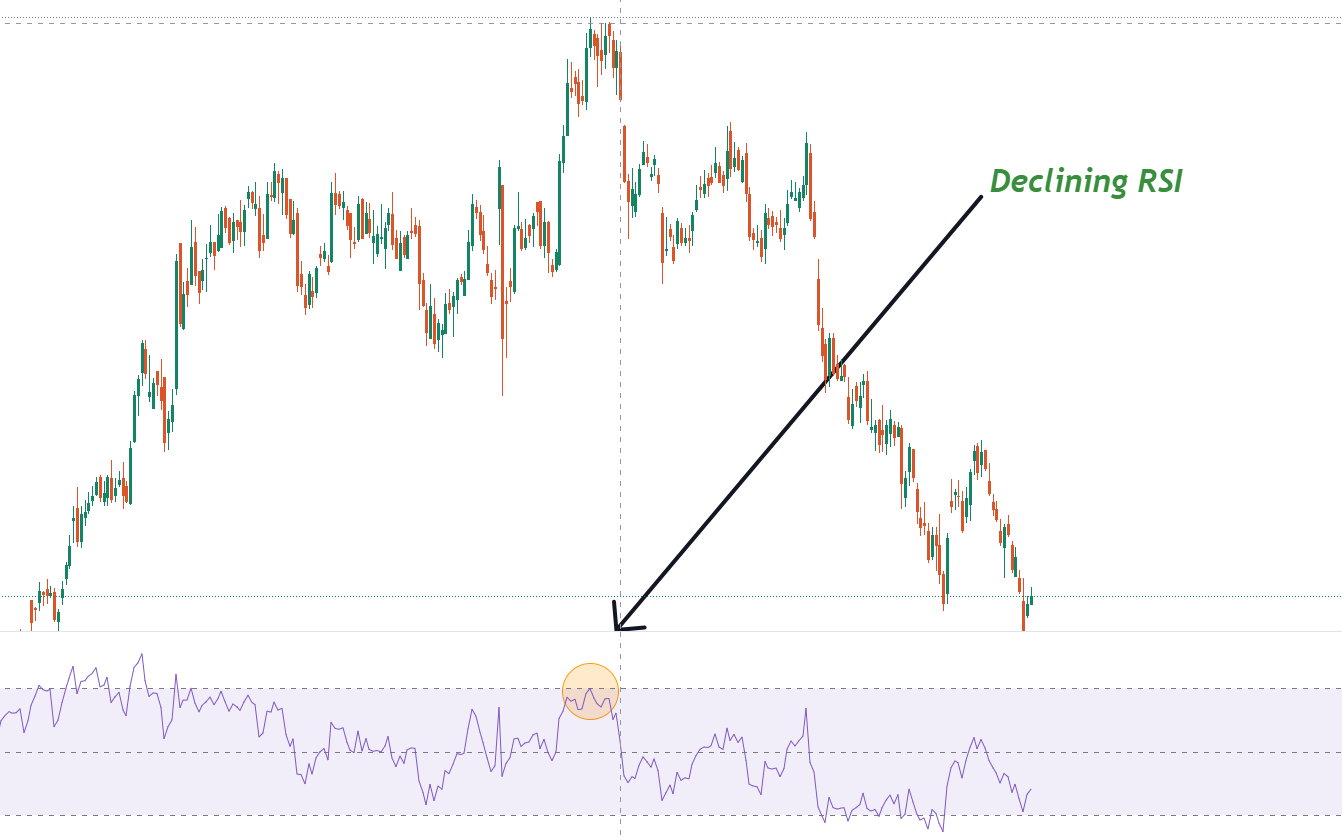
Interpreting RSI signals
When interpreting RSI signals, you should focus on divergences between the RSI and price movements. Bullish divergences occur when the RSI increases while prices decline, signaling potential upward reversals. Conversely, bearish divergences happen when the RSI falls despite rising prices, indicating possible downturns. You can also use the RSI to identify support and resistance levels, further enhancing your swing trading strategy. Now that we’ve covered RSI, let’s explore Mastering Bollinger Bands in the next section.
3. Mastering Bollinger Bands
Now that we’ve covered the Relative Strength Index (RSI), let’s take a look at another one of the best indicators for swing trading: Bollinger Bands. This versatile indicator can help you capitalize on short-term price movements within broader market trends.
How Bollinger Bands indicate volatility
Bollinger Bands reflect price volatility, expanding and contracting depending on market conditions. You will notice that the bands widen during periods of high volatility and narrow when the market is calm. This dynamic nature allows you to assess potential price fluctuations and adapt your trading strategy accordingly. By observing the behavior of the bands, you can gauge the current state of the market and predict potential trend reversal or continuation.
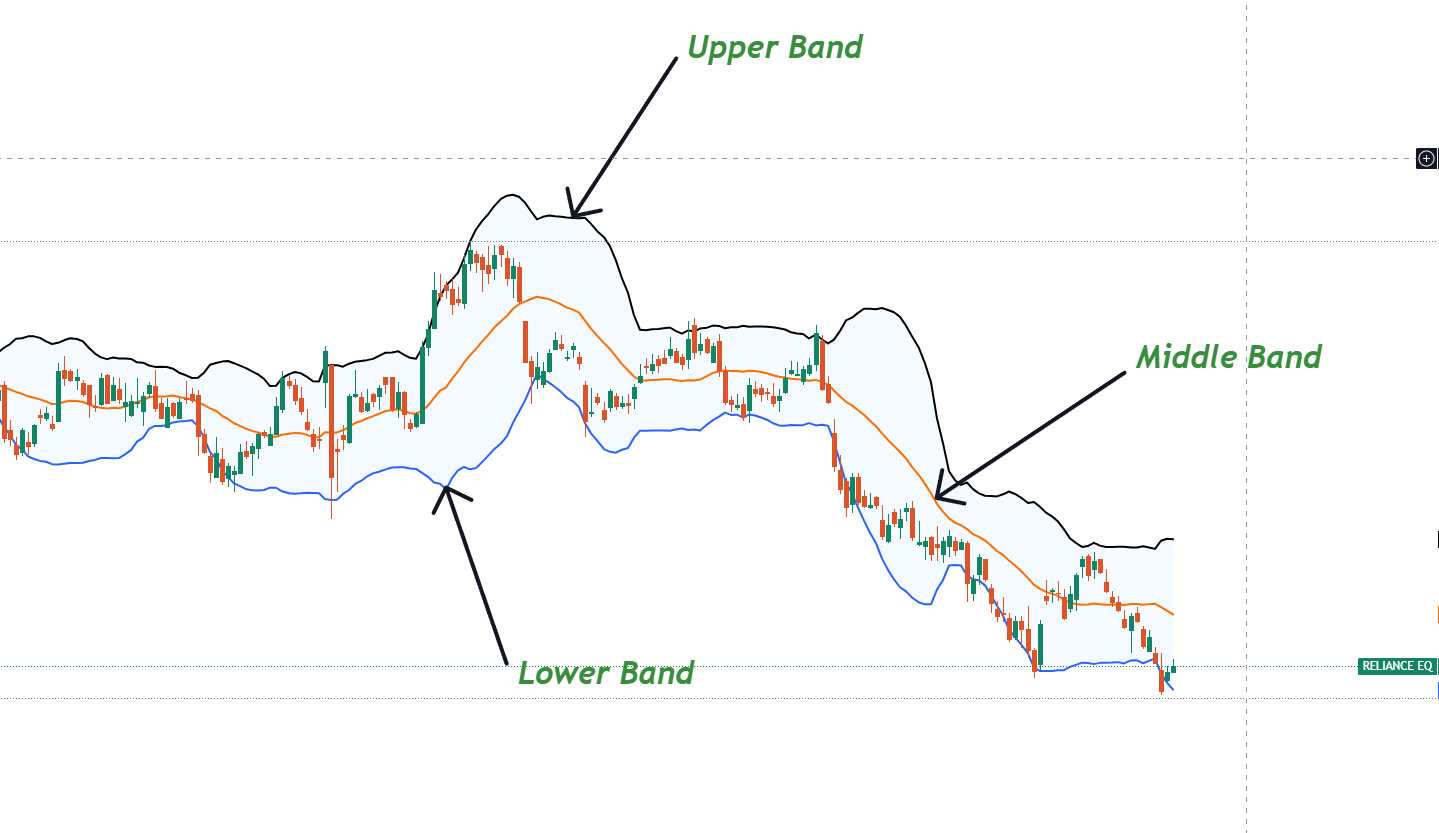
How to Use
If the price touches the upper band, it may be overbought. If it touches the lower band, it may be oversold. Bollinger Bands can also indicate periods of high or low volatility. A squeeze – the bands coming close to each other – would suggest a breakout from a period of low volatility; wide bands simply reflect high volatility.
Perfect swing trading setup:
If you apply all three ( MACD, Bollinger band, and RSI) indicators together then the accuracy of your trade will become better and stronger. Let me show you the best example:-
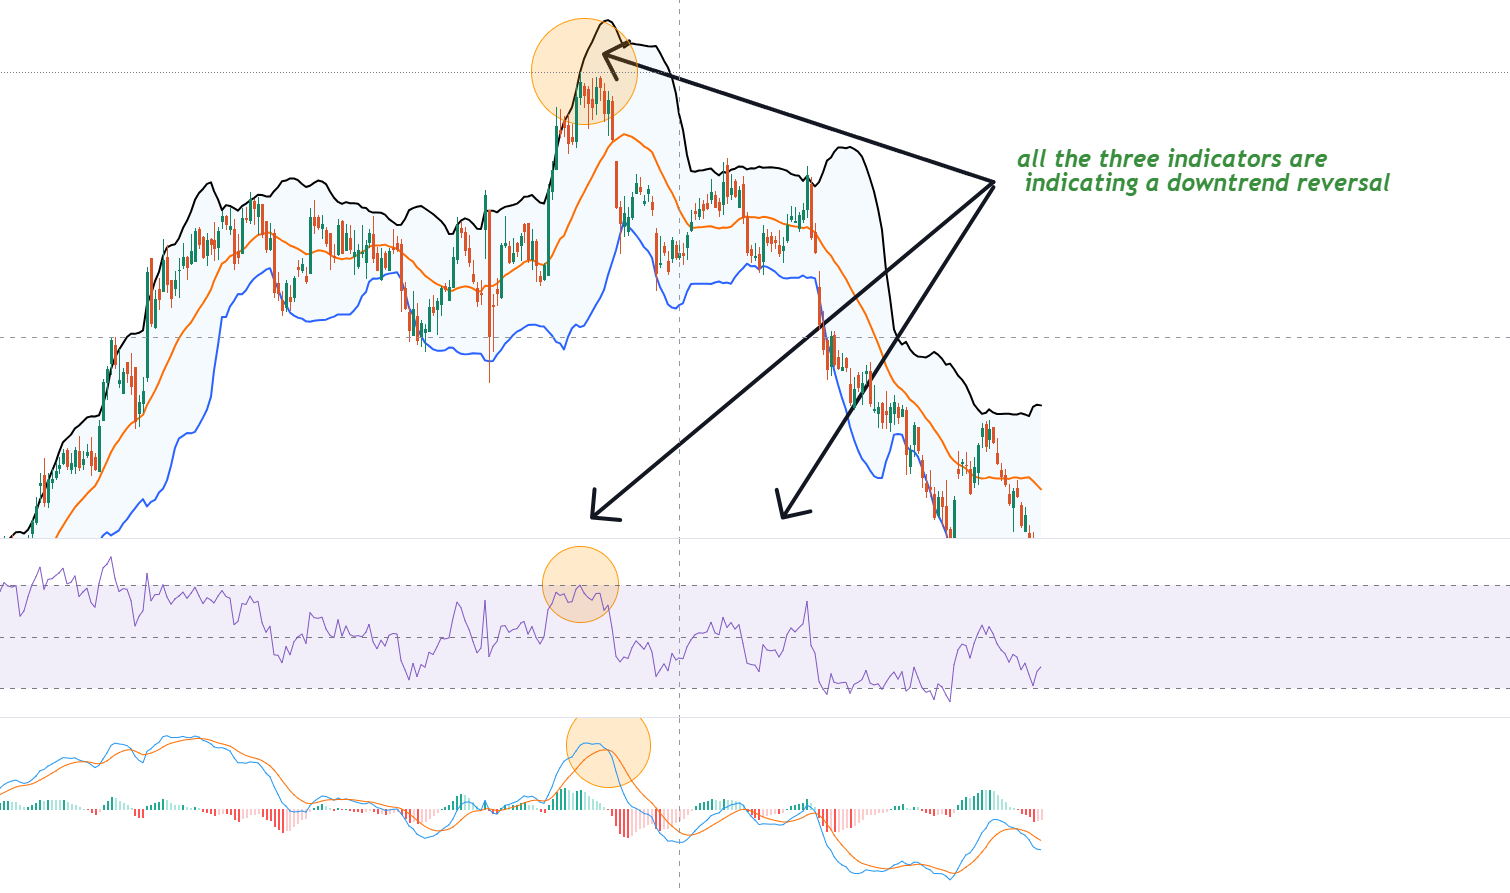
In the above diagram a combination of three best indicators for swing trading are showing a downtrend reversal. You can take a sell side entry here. And the accuracy level is very high.
Top Chart Patterns for Swing Trading
You can use these best indicators for swing trading on these chart patterns. Some effective patterns that will practically help you enhance your swing trading strategy:
- Flag and pole pattern
- Triangle pattern
- head and shoulders
- cup and handle
- double tops and bottoms
Advice a best swing trading strategy
With best indicators for swing trading as a trader i’ll suggest you a best swing trading strategy which I have used already:-
- Practice with a virtual money
Always practice any swing trading indicators in a demo account before real trading. This gives you time to try out different strategies and settings without risking your capital.
- Combine Indicators
Putting together several indicators can provide a more comprehensive view of the market and confirm the signals given. For example, moving averages combined with RSI will provide a clearer view of trend direction and momentum.
- Trading Journal
Keep a trading journal in which you record every trade you make and what indicators you used to make the trade. This helps the trader learn what works and what doesn’t, allowing him to improve his strategy over time.
The bottom line
Mastering the use of the RSI and Bollinger Bands can greatly improve your swing trading strategy. These powerful indicators provide valuable information about market momentum, overbought and oversold conditions, and potential trend reversals. By incorporating the RSI to assess the strength of price movements and the Bollinger Bands to identify volatility and potential breakouts, you will be better equipped to make informed trading decisions.
Remember, while these indicators are essential tools in your swing trading arsenal, they should not be used alone. Combine them with other technical analysis techniques, fundamental research, and risk management strategies to develop a comprehensive approach. As you gain experience and hone your skills, you will find that these indicators become invaluable companions on your journey to successful swing trading. Keep practicing, stay disciplined, and always be prepared to tweak your strategy according to market conditions.
FAQs
What are the best indicators for swing trading?
The best indicators for swing trading are usually those that help identify trend direction, momentum, and potential reversal points. Among the most effective indicators are the Relative Strength Index (RSI) and Bollinger Bands. These indicators provide valuable insight into market conditions, helping you make informed trading decisions.
How do I use RSI for swing trading?
To use the RSI for swing trading, you need to focus on overbought and oversold levels. Generally, an RSI reading above 70 indicates an overbought condition, which signals a potential selling opportunity. Conversely, an RSI below 30 indicates an oversold condition, which potentially signals a buying opportunity. However, it is important to use the RSI alongside other technical analysis tools for more reliable signals.
Can Bollinger Bands predict market reversals?
While Bollinger Bands cannot predict market reversals with absolute certainty, they can provide valuable information. When the price touches or breaks out of the upper band, it may indicate an overbought condition, which signals a possible downward reversal. Conversely, when the price touches or breaks below the lower band, it may indicate an oversold condition, which signals a possible upward reversal. Remember, it is necessary to confirm these signals with other indicators for more reliable trading decisions.
What time frames are best for swing trading?
Four-hour time frame.
Full detail blog is here :- https://royfinance.in/what-is-swing-trading-and-how-it-works-in-2025/